11/18/2014


source
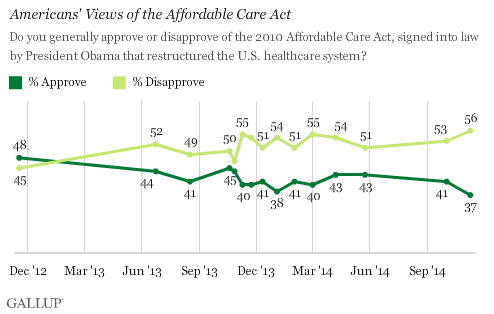
WASHINGTON, D.C. -- As the Affordable Care Act's second open enrollment period begins, 37% of Americans say they approve of the law, one percentage point below the previous low in January. Fifty-six percent disapprove, the high in disapproval by one point.

Americans were slightly more positive than negative about the law around the time of the 2012 election, but they have consistently been more likely to disapprove than approve of the law in all surveys that have been conducted since then. Approval has been in the low 40% or high 30% range after a noticeable dip that occurred in early November 2013. This was shortly after millions of Americans received notices that their current policies were being canceled, which was at odds with President Barack Obama's pledge that those who liked their plans could keep them. The president later said, by way of clarification, that Americans could keep their plans if those plans didn't change after the ACA was passed.
The current 37% reading comes on the heels of last week's midterm elections, in which Republicans won full control of both houses of Congress. Already, party leaders are discussing efforts to repeal the unpopular law.
Repeal is highly unlikely, given Obama's veto power, but the law's new low in approval -- and new high in disapproval (56%) -- could potentially have an impact on its future. The president himself has acknowledged he will consider modifications to the law, which could include repealing the tax on medical devices.
Approval Among Independents at 33%
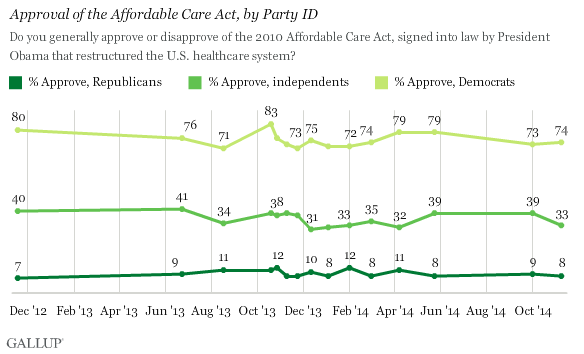
Approval of the law continues to diverge sharply by party, with 74% of Democrats and 8% of Republicans approving of it. Independents have never been particularly positive toward the law, with approval ranging between 31% and 41%. Currently, 33% of independents approve.

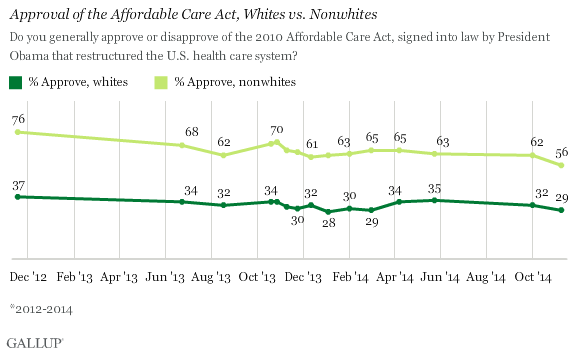
Nonwhites, who disproportionately identify as Democrats, have maintained majority approval since the ACA's inception, now at 56%. Though this is still about double the level of approval among whites (29%), it is the first time nonwhites have fallen below the 60% mark.

Bottom Line
Americans have never been overly positive toward the ACA, at best showing a roughly equal division between approval and disapproval early on in the law's implementation. The percentage of Americans who approve of the law represents a new numerical low, which could indicate a loss of faith in the law amid the aftermath of the 2014 midterms. Although the ACA, also called Obamacare, was not as dominant an issue in this year's congressional elections as it was in 2010, the issue was part of Republicans' campaign efforts to oppose the president's agenda overall. In doing that, many of the party's candidates were successful.
Though the law's implementation suffered setbacks last fall, government officials have greater optimism for the health insurance website's usability this time around. Importantly, though, approval of the law has remained low throughout the year even as it has had obvious success in reducing the uninsured rate. And with approval holding in a fairly narrow range since last fall, it may be that Americans have fairly well made up their minds about the law, and even a highly successful second open enrollment period may not do much to boost their approval.
Survey Methods
Results for this Gallup poll are based on telephone interviews conducted Nov. 6-9, 2014, on the Gallup U.S. Daily survey, with a random sample of 828 adults, aged 18 and older, living in all 50 U.S. states and the District of Columbia. For results based on the total sample of national adults, the margin of sampling error is ±4 percentage points at the 95% confidence level.
Each sample of national adults includes a minimum quota of 50% cellphone respondents and 50% landline respondents, with additional minimum quotas by time zone within region. Landline and cellular telephone numbers are selected using random-digit-dial methods.
Learn more about how Gallup Poll Social Series works.
source
No comments:
Post a Comment