2/9/2015
source
This story is part of Gallup's annual "State of the States" series, which reveals state-by-state differences on political, economic, religion and well-being measures.
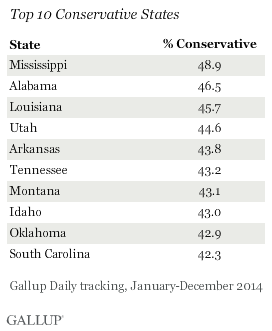
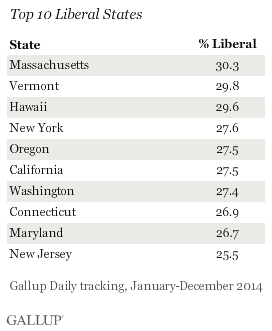
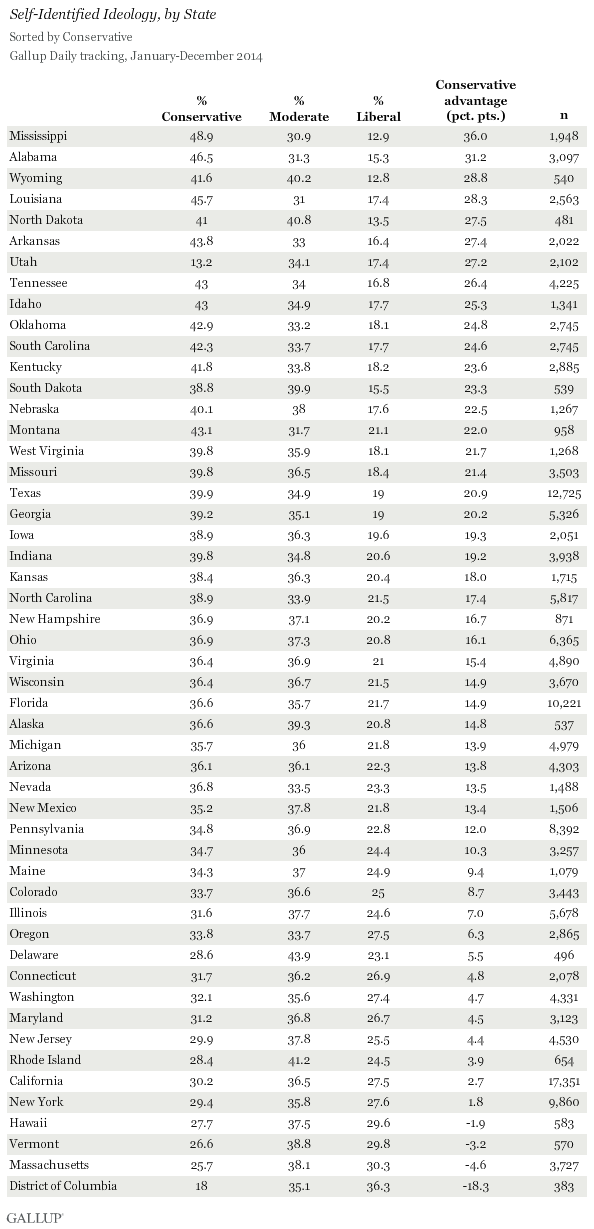
PRINCETON, N.J. -- Mississippi, Alabama and Louisiana are the most right-leaning states in the union, with between 46% and 49% of residents in each identifying as politically conservative. Massachusetts, Vermont and Hawaii are the most left-leaning, with 30% of residents in each of those states identifying as liberal.


The top 10 most conservative states in 2014 are very similar to the top 10 in 2013, with the exception of Louisiana, which was not in the top 10 list in 2013, but replaced Wyoming in the top 10 this year.
The list of the top 10 most conservative states is also similar to what it was in 2008, the first year Gallup tracked ideology daily. Mississippi was the most conservative state in 2008 and remains the most conservative in 2014, with 49% of residents identifying as conservative in both years. Three states -- Louisiana, Oklahoma and Montana -- were not in the top 10 list in 2008 but are in 2014, while South Dakota, Wyoming and Texas dropped out of the top 10 list over the past seven years.
Eight of the top 10 most liberal states in 2014 were on the top 10 list 2013. The other two -- Connecticut and Maryland -- replaced Delaware and Maine, which appeared in the top 10 in 2013. The only two states in the top 10 most liberal list this year that were not in the top 10 in 2008 are Maryland and New Jersey, and in that year, they came in ranked just below the top 10.
These results are based on Gallup Daily tracking interviews throughout 2014 with 177,034 U.S. adults. Gallup asks Americans if they describe their political views as very conservative, conservative, moderate, liberal or very liberal. The results shown combine the two conservative and the two liberal categories.
Conservative States Mostly in the South; Liberal States on the Coasts
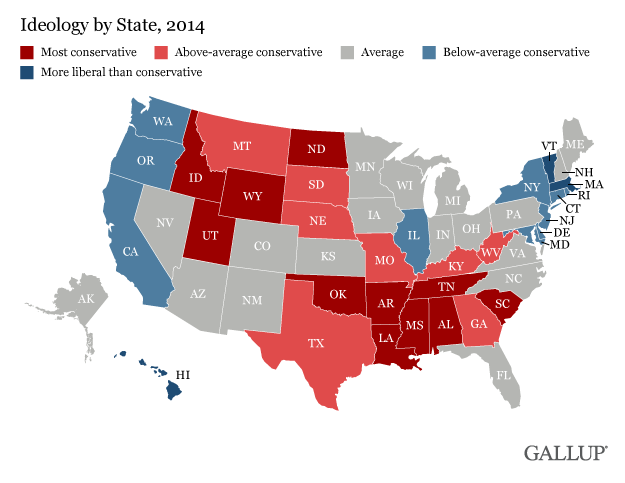
Six of the top 10 most conservative states are located in the South (Mississippi, Alabama, Louisiana, Arkansas, Tennessee and South Carolina). Three others are in the Mountain West (Utah, Wyoming and Idaho), and one is Oklahoma -- straddling the Midwest/southern border.
The top 10 liberal states are primarily located in the outer longitudes of the U.S.: touching or close to the Atlantic Ocean (Vermont, Massachusetts, Connecticut, New York, New Jersey and Maryland), and the Far West (Oregon, California, Washington and Hawaii).
The accompanying map displays the "conservative advantage," defined as the percentage conservative minus the percentage liberal in each state. The results for each state are shown in a table at the end of the article and will be available today in Gallup's "State of the States" interactive.

Some States Ideologically Different From Their Neighbors
Although the general distribution of ideology reflects a clustered regional pattern, history and specific cultural patterns can produce different ideological patterns even among states that share borders. One example of a state that is quite different ideologically from its neighbors is New Hampshire, which is more conservative than the national average, yet borders the two most liberal states in the union: Massachusetts and Vermont. Another example is Illinois, one of the more liberal states in the union, which shares borders with five states that are average or above average in their net conservative rating (Wisconsin, Iowa, Missouri, Kentucky and Indiana).
Delaware Is Most Moderate State
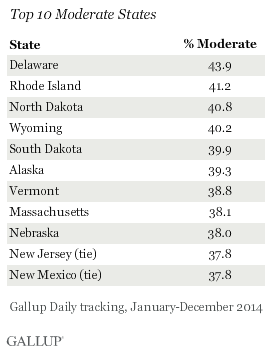
The most moderate states are fairly geographically diverse. Delaware has the highest percentage of moderates of any state in the union, at 44%. The higher percentage of moderates in a given state does not necessarily mean that the state is a swing state politically. Despite the high percentages of residents choosing the moderate label, in many of these states, the remainder of the residents skew significantly conservative or liberal. For example, Rhode Island, Vermont, Massachusetts and New Jersey are all high on both the moderate and the liberal list, meaning that residents in these states eschew the conservative label while being more likely than average to identify with the other two categories. The same phenomenon occurs with states such as North Dakota and Wyoming, where residents are well above average in choosing either the moderate or conservative label, while avoiding the liberal label.

Implications
Americans have become slightly less conservative and more liberal in recent years, while at the same time, with a few exceptions, the differences in ideology across the 50 states has generally remained quite stable. The most conservative states both seven years ago and now are mainly located in the South and the Mountain West, while the most liberal states are basically located along the East and West Coasts.
This overview of the ideology of states is based on self-descriptions using a general conservative to liberal scale, and thus measures how each American sums up his or her ideological bent. There can be significant divergences in more specific ideological positioning, such as between those who may be conservative or liberal on economic matters, while holding the opposite position on a social matters. Nevertheless, these results roughly conform with the political orientation of states in elections, and the order is similar to Gallup's state rankings of presidential job approval and political party identification.
Survey Methods
Results for this Gallup poll are based on telephone interviews conducted Jan. 2-Dec. 30, 2014, on the Gallup Daily tracking survey, with a random sample of 177,034 adults, aged 18 and older, living in all 50 U.S. states and the District of Columbia.
For results based on the total sample of national adults, the margin of sampling error is ±1 percentage point at the 95% confidence level.
Margins of error for individual states are no greater than ±6 percentage points, and are ±3 percentage points in most states. All reported margins of sampling error include the computed design effects for weighting.
Interviews are conducted with respondents on landline telephones and cellular phones, with interviews conducted in Spanish for respondents who are primarily Spanish-speaking. Each sample of national adults includes a minimum quota of 50% cellphone respondents and 50% landline respondents, with additional minimum quotas by time zone within region. Landline and cellular telephone numbers are selected using random-digit-dial methods. Landline respondents are chosen at random within each household on the basis of which member had the most recent birthday.
Samples are weighted to correct for unequal selection probability, nonresponse and double coverage of landline and cell users in the two sampling frames. National samples are weighted to match the national demographics of gender, age, race, Hispanic ethnicity, education, region, population density and phone status (cellphone only/landline only/both, cellphone mostly and having an unlisted landline number). Demographic weighting targets are based on the most recent Current Population Survey figures for the aged 18 and older U.S. population. Phone status targets are based on the most recent National Health Interview Survey. Population density targets are based on the most recent U.S. census. State samples are weighted to match state demographics of gender, age, race, Hispanic ethnicity and region. State demographic weighting targets are based on the most recent Nielsen Claritas data set.
Learn more about how the Gallup U.S. Daily works.

source
No comments:
Post a Comment