Submitted by ilene
04/04/2012 03:33 -0400
Zero Hedge
Courtesy of Lee Adler of the Wall Street Examiner
In today’s conomic news, the mainstream media focused on the disappointment surrounding the FOMC Minutes, the massaged and sanitized fairy tale about what the participants said at last month’s FOMC confab. The market was shocked! SHOCKED! that most of the members saw no need for additional QE, unless things got worse. I had concluded that a couple of months ago based on the fact that every time QE speculation arose, not only did stocks rally, but so did energy and other commodity prices. The commodity vigilantes, I thought, would tie the Fed’s hands. That and the fact that the conomic data was coming in relatively perky, at least in terms of the headline data, made it highly unlikely that the Fed would do any more money printing.
But here’s the thing. The minutes are fake. They are fabricated, false, phony, and sterilized garbage, designed for public consumption. To put it bluntly, they’re propaganda. They are what the Fed and Wall Street casino owners want you to think. They are a blatant attempt to manipulate the behavior of market participants through the use of clever turns of phrase. The Fed wants the market to go higher, but it doesn’t want commodities to go with it, so its story line is that the conomy is healthy enough to continue growing without more QE. That gives traders reason to continue buying stocks, and no reason to buy commodities, which everyone “knows” go up when the Fed prints, in spite of Bernanke’s denials. And besides, commodities are up for other reasons, not anything Ben did, according to Ben.
That’s what these “minutes” are about, self justification and market manipulation. We won’t know the real story until February 2018 when the Fed will release the transcripts of this year’s FOMC meetings. Why do they hold them back for at least 5 years? Because the Fed thinks that you can’t handle the truth. The problem is that you can and they just don’t want you to know what it is, because if you did, you’d be able to make informed investment decisions. The decisions the Fed wants you to make are to buy stocks, bay and hold Treasuries, and sell commodities. They tailored the minutes accordingly, so that the headlines would elicit the desired response. They think that they’re Pavlov, and we’re the dogs.
Admittedly, I have not yet read the minutes (I will for this weekend’s Fed Report), but I have read the news headlines. Those headlines are what the Fed-Wall Street-Media-Industrial Complex wants you to think, so you really don’t need to read the minutes. Rest assured that the Fed got the propaganda it wanted. The market reaction it wanted it hasn’t yet gotten, yet, but the Fed is betting that it will, and therein lies the rub. The Fed doesn’t always get what it wants. If traders decide to sell the Dow off 200 points in response to this news, then the next morning, the Fed’s ventriloquist dummy, Jon Hilsenrath, will float another QE3 trial balloon in the Wall Street Urinal.
So we’ll just have to see how traders respond. As for what the Fed really thinks, sorry, that will have to wait 6 years.
Meanwhile, the other datapoint the conomists focused on today was February Factory Orders. This is an item based on a Census Bureau monthly survey of a tiny sampling of US manufacturers that extrapolates that sample into a total dollar estimate of new orders and other metrics. The Bureau reports both the seasonally adjusted result and the actual result, also known as not seasonally adjusted. The only number the pundits and media pay attention to is the seasonally adjusted, fictional number. That’s just wrong, but that’s the way it is. It gives us the opportunity to look at the actual data and know what’s really going on, rather than the smoothed fiction that the Wall Street mouthpieces present on a silver platter as if it’s the grail.
The headline number for February was a 1.3% month to month increase, seasonally smoothed. That was a miss. The conomic consensus was for a gain of 1.5%. But this is a minor item in the conomic firmament–durable goods orders out the week before are more important–and the pundits managed to spin it as bullish anyway. The bullishness is wild and universal, nary a contrarian to be found in the pages of the Murdoch, Bloomberg tout sheets.
The headline number isn’t always wrong or misleading, and as it turns out, the actual, not seasonally adjusted gain in February was impressive, up 4.7% from January and up 10.6% over February 2011, both in real terms adjusted by CPI inflation. The 4.7% monthly gain compared with a decline of 0.7% in February 2011. Over the prior 10 years, monthly changes in February ranged from last year’s -0.7% to a high of +4.9% in February 2004. Any way you slice it this was a good number. Did the warm weather in February have anything to do with that? Certainly, but it’s impossible to say how much. If it pulled demand forward from March and April, we’ll see that in the next month or two.
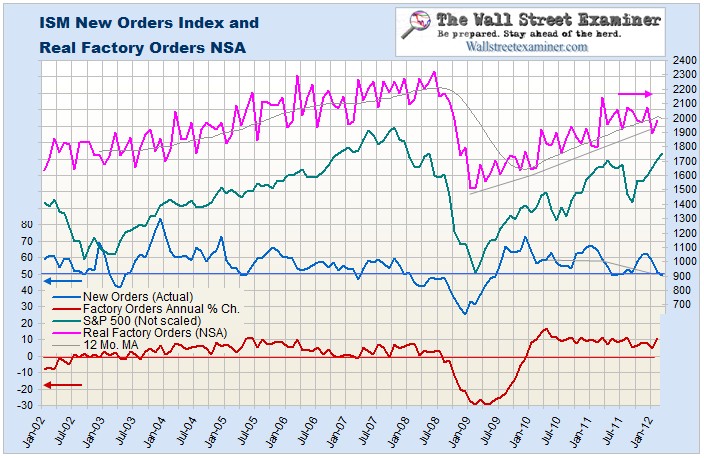
I thought it would be interesting to overlay the ISM’s not seasonally adjusted New Orders Index on the chart of new factory orders. I am using the factory orders not seasonally adjusted data, but adjusted for inflation in order to see the real change in unit volume over time. The ISMsurvey should lead the Factory Orders. The ISM data is for March. It turns out that the correlation with the between the ISM New Orders Index, and the 12 month rate of change in the Commerce Department’s New Factory Orders data is pretty close. Lately, however, the ISM data suggests greater weakness than has been showing up in the government data. Who’s right? I don’t know, but as with the ISM and the 50 line on its chart, an annual change in factory orders of more than 1 to 2%, tends to correlate with an ongoing uptrend in stocks. It will be time to start worrying when the growth rate closes in on zero. That has correlated with a topping process in stocks.
Real Factory Orders NSA Chart
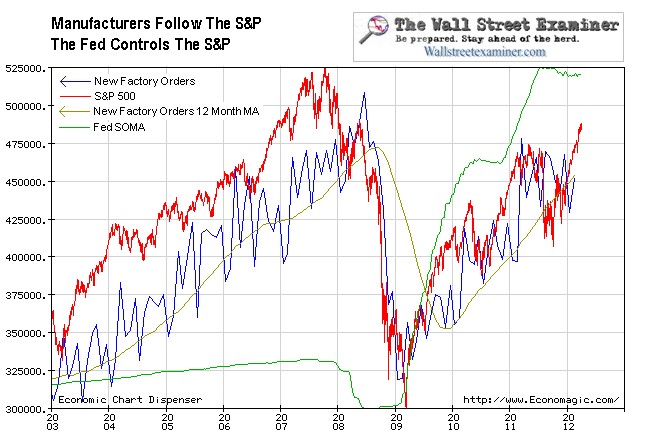
Manufacturing activity lags stock prices. By the time new factory orders go negative, stocks will have already gone through their first leg down. Consumers and businesses take their cues from the stock market, and the stock market takes its cues from the Fed.
Everybody thinks that Dr. Bernankenstein’s monster alphabet soup experiments, and Henry Paulson’s TARP saved the world from conomic collapse. The fact is that they caused, or at least exacerbated the conomic collapse. Take the manufacturing orders data as an example of how that unfolded.
Fed, Stocks, and Factory Orders Chart
The manufacturing conomy was doing just fine until Bernanke stopped feeding the Primary Dealers and actually starved them out early in 2008. He did that by paying for his crazy alphabet soup programs with cash from the Fed’s System Open Market Account. In selling and redeeming Treasuries from the SOMA he radically shrank the cash levels in Primary Dealer accounts, rendering them unable to maintain orderly markets. The dealers are, after all, not just market makers in Treasuries. They run all the markets, stocks, bonds, commodities, futures, options, everything. They are the big mahoffs of all the markets, and Ben is their banker and bagman.
So manufacturing was doing just fine in 2007 and 2008 until stocks broke down. Stocks broke because of the combination of the Fed starving out the Primary Dealers in late 2007 and the first half of 2008, followed by Henry Paulson’s bravura panic performance before House and Senate committees, convincing Congress to fund the $700 billion TARP. Bernanke was best supporting actor at those hearings.
Faced with the testimony of the two dynamite strapped suicide extortionists, Congress caved, and the Treasury raised that money in a few short weeks in September and October 2008. That forced the dealers (and others) to absorb $100-200 billion a week of new Treasury supply at a time when the Fed had already cut their balls off. They were in no position to absorb anything. The Fed had taken their manhood and all their cash.
In order to perform their function as Primary Dealers and absorb that part of the new Treasury supply not purchased by others, the dealers had no choice but to liquidate stocks. Because most economic units, both individual consumers and businesses, base their purchase decisions on the stock market, when it cratered that was their signal to consumers and business to be scared, be very scared, and hunker down in fear in their mental bunkers.
Manufacturing orders were still very strong in June 2008. They didn’t collapse until after Bernanke and Paulson triggered the panic. In October 2008, they collapsed on the heels of the Bernanke-Paulson Panic.
The Fed finally figured it out in February 2009, and it started a radical program of pumping hundreds of billions into the accounts of the Primary Dealers with QE1. The stock market and manufacturing orders rebounded almost immediately. When the Fed experimented with withholding funds in mid 2010, stocks plunged and manufacturing activity stalled. Double dip fears exploded and the Fed resumed pumping cash into dealer accounts.
Flash forward to today and the Fed is again on hold, although its MBS replacement purchase program helps to keep the dealers liquid. The effect of that program on dealer accounts is not reflected in the SOMA, but it does send cash to dealer accounts. The effects of the program on stock prices are clear.
The issue now is when will the Fed make its next catastrophic blunder. Just by tapping the brakes on the SOMA, it is creating conditions for another swoon. It is trying to hold back commodity prices while getting the benefit of conomic growth. The problem is that that growth is a second order bubble effect of the rising stock market. If they don’t feed the market, they won’t get their conomic growth. If they do feed the market, commodity prices will explode upward, and that will eventually put a stake in the heart of growth. For now, manufacturing activity is on a growth track. On the surface it appears that the Fed’s propaganda and manipulation is working, but in truth Bernanke has laid the groundwork for the Fed’s next blunder, panic move, and massive dislocation.
Copyright © 2012 The Wall Street Examiner. All Rights Reserved. This article may be reposted with attribution and a prominent link to the source The Wall Street Examiner.


No comments:
Post a Comment