His comments prompted me to investigate what Real GDP would look like if we used the PCE Deflator or the Consumer Price Index for the adjustment. First, here is the key comment from Rick:
The importance of the price deflator used by the BEA cannot be overstated. In calculating the "real" GDP the BEA continued to use an overall 1.9% annualized inflation rate, which is substantially lower than the inflation rates being reported by any of the BEA's sister agencies. The mathematical implications of the deflator are simple: a lower deflator creates a higher "real" GDP reading.
(May 26, 2011 Commentary)
Rick goes on to show that the Real GDP reported by the BEA, 1.84% to two decimal places, shrinks to 0.56% if the Consumer Price Index were used as the deflator. Rick's observation was sufficiently striking to catch the attention of John Mauldin, who referenced it under the heading Gaming the GDP Numbers in his newsletter.
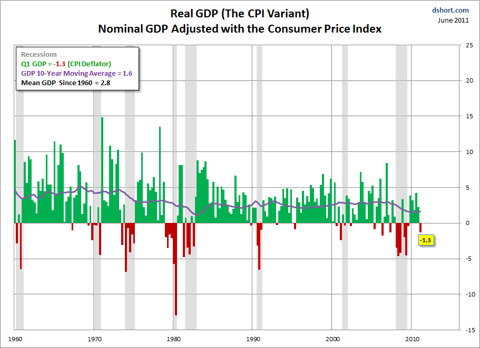
Let's take Rick's substitution of CPI for the GDP deflator a couple of steps further. I've prepared a set of charts showing Real GDP, quarterly, since 1960. The first is the official series as calculated by the BEA with the GDP deflator. The second starts with nominal GDP and adjusts using the PCE Deflator, which is also a product of the BEA. The third adjusts nominal GDP with the BLS (Bureau of Labor Statistics) Consumer Price Index for Urban Consumers (CPI-U, or as I prefer, just CPI).
Suggestion: Click on any of the charts below and use the links at the top of the chart page to toggle between the three versions for a closer comparison.
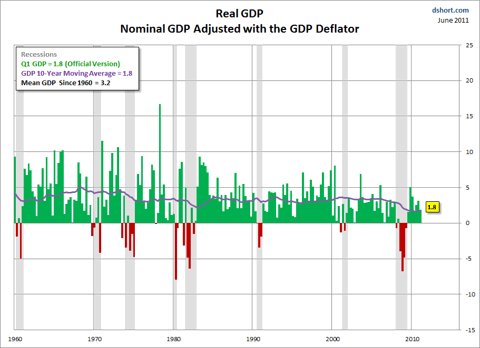
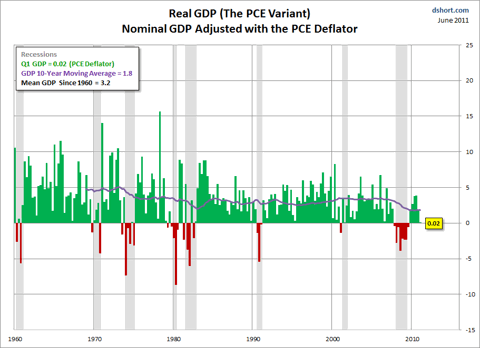
As we might expect, the two deflators from the BEA produce similar results. The average (arithmetic mean) Real GDP for the first and second charts is the 3.2%. But note the variation from quarter-to-quarter and especially the weaker GDP since the end of the Great Recession in the PCE-adjusted version. In fact, I had to display the latest GDP to two decimal places to see a value other than zero.
The CPI comes from a different government agency, the Bureau of Labor Statistics, and is calculated quite differently. As an inflation measure, it is much better known than the GDP and PCE deflators, and its growth rate has been higher than the two BEA metrics (see this illustration). If we use CPI as the deflator to compute Real GDP, we see series with a significantly lower mean, higher volatility, and Q1 Real GDP at a stunningly negative -1.3%.
Given the higher volatility of the CPI-adjusted series, I wouldn't necessarily see any strong implications for Q2 GDP. However, it is perhaps telling that both the PCE and CPI variants are well below the official Real GDP.
I'll be updating this chart series for all future GDP releases.
Notes:
Quarterly GDP dates from 1947, CPI has been tracked since 1913, but PCE only goes back to 1959. Thus I used 1960 as the start date for the chart series. The 1959 inception of PCE explains why the 10-year moving average in the second chart starts later than the other two.
The three deflators are available from the Federal Reserve Bank of St. Louis data repository: GDP Deflator, GDP Deflator, PCE Deflator, and CPI-U
For the PCE and CPI-U data series I used the average of the monthly values for each quarter to ensure a true comparison with the quarterly numbers in the GDP deflator.
I created the charts in Excel using a two-step process. I calculated the Real quarterly GDP for each deflator against the nominal GDP series. I then used this function to calculate the individual quarters: ((Q/previous Q)^4-1)*100
No comments:
Post a Comment